111
RBI RBI AG
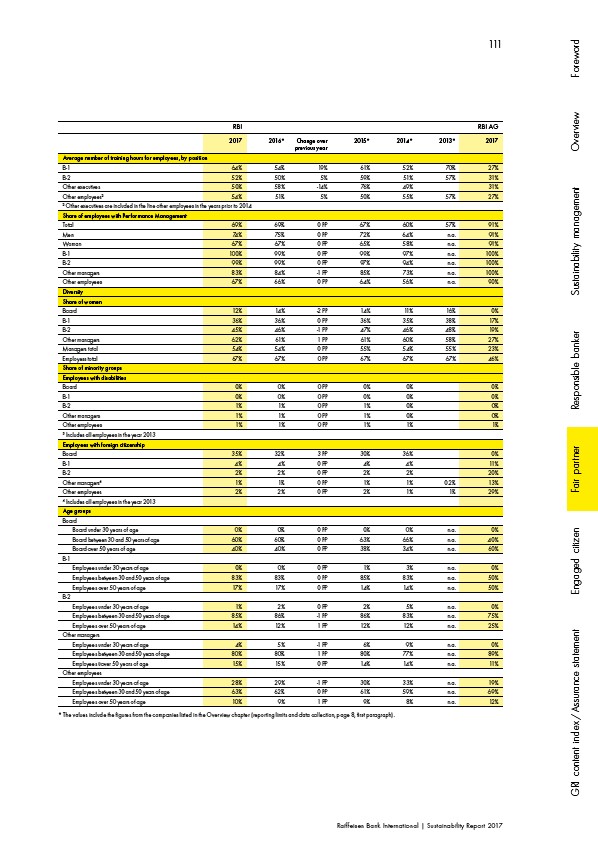
2017 2016* C hange over 2015* 2014* 2013* 2017
previous year
Average number of training hours for employees, by position
B-1 64% 54% 19% 61% 52% 70% 27%
B-2 52% 50% 5% 59% 51% 57% 31%
Other executives 50% 58% -14% 76% 49% 31%
Other employees2 54% 51% 5% 50% 55% 57% 27%
2 Other executives are included in the line other employees in the years prior to 2014
Share of employees with Performance Management
Total 69% 69% 0 PP 67% 60% 57% 91%
Men 74% 75% 0 PP 72% 64% n.a. 91%
Woman 67% 67% 0 PP 65% 58% n.a. 91%
B-1 100% 99% 0 PP 99% 97% n.a. 100%
B-2 99% 99% 0 PP 97% 94% n.a. 100%
Other managers 83% 84% -1 PP 85% 73% n.a. 100%
Other employees 67% 66% 0 PP 64% 56% n.a. 90%
Diversity
Share of women
Board 12% 14% -2 PP 14% 11% 16% 0%
B-1 36% 36% 0 PP 36% 35% 38% 17%
B-2 45% 46% -1 PP 47% 46% 48% 19%
Other managers 62% 61% 1 PP 61% 60% 58% 27%
Managers total 54% 54% 0 PP 55% 54% 55% 23%
Employess total 67% 67% 0 PP 67% 67% 67% 46%
Share of minority groups
Employees with disabilities
Board 0% 0% 0 PP 0% 0% 0%
B-1 0% 0% 0 PP 0% 0% 0%
B-2 1% 1% 0 PP 1% 0% 0%
Other managers 1% 1% 0 PP 1% 0% 0%
Other employees 1% 1% 0 PP 1% 1% 1%
3 Includes all employees in the year 2013
Employees with foreign citizenship
Board 35% 32% 3 PP 30% 36% 0%
B-1 4% 4% 0 PP 4% 4% 11%
B-2 2% 2% 0 PP 2% 2% 20%
Other managers4 1% 1% 0 PP 1% 1% 0.2% 13%
Other employees 2% 2% 0 PP 2% 1% 1% 29%
4 Includes all employees in the year 2013
Age groups
Board
Board under 30 years of age 0% 0% 0 PP 0% 0% n.a. 0%
Board between 30 and 50 years of age 60% 60% 0 PP 63% 66% n.a. 40%
Board over 50 years of age 40% 40% 0 PP 38% 34% n.a. 60%
B-1
Employees under 30 years of age 0% 0% 0 PP 1% 3% n.a. 0%
Employees between 30 and 50 years of age 83% 83% 0 PP 85% 83% n.a. 50%
Employees over 50 years of age 17% 17% 0 PP 14% 14% n.a. 50%
B-2
Employees under 30 years of age 1% 2% 0 PP 2% 5% n.a. 0%
Employees between 30 and 50 years of age 85% 86% -1 PP 86% 83% n.a. 75%
Employees over 50 years of age 14% 12% 1 PP 12% 12% n.a. 25%
Other managers
Employees under 30 years of age 4% 5% -1 PP 6% 9% n.a. 0%
Employees between 30 and 50 years of age 80% 80% 1 PP 80% 77% n.a. 89%
Employees üover 50 years of age 15% 15% 0 PP 14% 14% n.a. 11%
Other employees
Employees under 30 years of age 28% 29% -1 PP 30% 33% n.a. 19%
Employees between 30 and 50 years of age 63% 62% 0 PP 61% 59% n.a. 69%
Employees over 50 years of age 10% 9% 1 PP 9% 8% n.a. 12%
Raiffeisen Bank International | Sustainability Report 2017
GRI content index / Assurance statement Engaged citizen Fair partner Responsible banker Sustainability management Overview Foreword
* The values include the figures from the companies listed in the Overview chapter (reporting limits and data collection, page 8, first paragraph).