120
Overview of key performance indicators
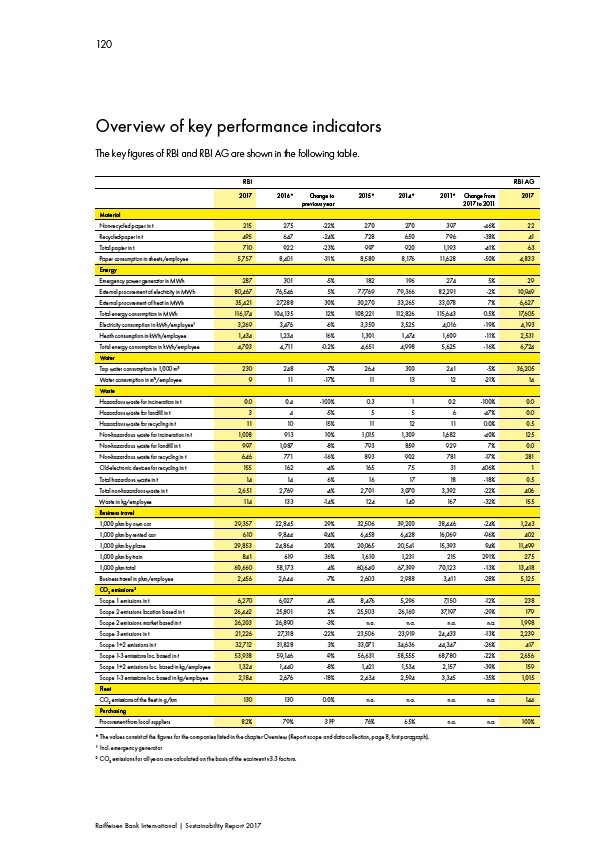
The key figures of RBI and RBI AG are shown in the following table.
RBI RBI AG
2017 2016* C hange to 2015* 2014* 2011* C hange from 2017
previous year 2017 to 2011
Material
Non-recycled paper in t 215 275 -22% 270 270 397 -46% 22
Recycled-paper in t 495 647 -24% 728 650 796 -38% 41
Total papier in t 710 922 -23% 997 920 1,193 -41% 63
Paper consumption in sheets/employee 5,757 8,401 -31% 8,580 8,176 11,628 -50% 4,833
Energy
Emergency power generator in MWh 287 301 -5% 182 196 274 5% 29
External procurement of electricity in MWh 80,467 76,546 5% 77,769 79,366 82,291 -2% 10,949
External procurement of heat in MWh 35,421 27,288 30% 30,270 33,265 33,078 7% 6,627
Total energy consumption in MWh 116,174 104,135 12% 108,221 112,826 115,643 0.5% 17,605
Electricity consumption in kWh/employee1 3,269 3,476 -6% 3,350 3,525 4,016 -19% 4,193
Heath consumption in kWh/employee 1,434 1,234 16% 1,301 1,474 1,609 -11% 2,531
Total energy consumption in kWh/employee 4,703 4,711 -0.2% 4,651 4,998 5,625 -16% 6,724
Water
Tap water consumption in 1,000 m3 230 248 -7% 264 300 241 -5% 36,205
Water consumption in m3/employee 9 11 -17% 11 13 12 -21% 14
Waste
Hazardous waste for incineration in t 0.0 0.4 -100% 0.3 1 0.2 -100% 0.0
Hazardous waste for landfill in t 3 4 -5% 5 5 6 -47% 0.0
Hazardous waste for recycling in t 11 10 15% 11 12 11 0.0% 0.5
Non-hazardous waste for incineration in t 1,008 913 10% 1,015 1,309 1,682 -40% 125
Non-hazardous waste for landfill in t 997 1,087 -8% 793 859 929 7% 0.0
Non-hazardous waste for recycling in t 646 771 -16% 893 902 781 -17% 281
Old-electronic devices for recycling in t 155 162 -4% 165 75 31 406% 1
Total hazardous waste in t 14 14 6% 16 17 18 -18% 0.5
Total non-hazardous waste in t 2,651 2,769 -4% 2,701 3,070 3,392 -22% 406
Waste in kg/employee 114 133 -14% 124 140 167 -32% 155
Business travel
1,000 pkm by own car 29,357 22,845 29% 32,506 39,200 38,446 -24% 1,243
1,000 pkm by rented car 610 9,844 -94% 6,458 6,428 16,069 -96% 402
1,000 pkm by plane 29,853 24,864 20% 20,065 20,541 15,393 94% 11,499
1,000 pkm by train 841 619 36% 1,610 1,231 215 291% 275
1,000 pkm total 60,660 58,173 4% 60,640 67,399  70,123 -13% 13,418
Business travel in pkm/employee 2,456 2,644 -7% 2,603 2,988 3,411 -28% 5,125
CO2 emissions2
Scope 1 emissions in t 6,270 6,027 4% 8,476 5,296 7,150 -12% 238
Scope 2 emissions location based in t 26,442 25,801 2% 25,503 26,160 37,197 -29% 179
Scope 2 emissions market based in t 26,203 26,890 -3% n.a. n.a. n.a. n.a. 1,998
Scope 3 emissions in t 21,226 27,318 -22% 23,506 23,919 24,433 -13% 2,239
Scope 1+2 emissions in t 32,712 31,828 3% 33,071 34,636 44,347 -26% 417
Scope 1-3 emissions loc. based in t 53,938 59,146 -9% 56,631 58,555 68,780 -22% 2,656
Scope 1+2 emissions loc. based in kg/employee 1,324 1,440 -8% 1,421 1,534 2,157 -39% 159
Scope 1-3 emissions loc. based in kg/employee 2,184 2,676 -18% 2,434 2,594 3,345 -35% 1,015
Fleet
CO2 emissions of the fleet in g/km 130 130 0.0% n.a. n.a. n.a. n.a. 144
Purchasing
Procurement from local suppliers 82% 79% 3 PP 76% 65% n.a. n.a. 100%
* The values consist of the figures for the companies listed in the chapter Overview (Report scope and data collection, page 8, first paragraph).
1 Incl. emergency generator
2 CO2 emissions for all years are calculated on the basis of the ecoinvent v3.3 factors.
Raiffeisen Bank International | Sustainability Report 2017