
Page 19 - RBI FIntech Atlas 2018
P. 19
19
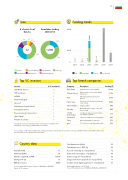
Size
# of active local ntechs
Funding trends
Cumulative funding €5M 2008-2018
6 33 9
0
9% 6%3%
3 2 1 3% 22%
9%
3
10
31%
Insurance Corporate Banking Retail Banking SME Banking
Top VC investors
1
12
38%
32 €28M
€1M 78%
Capital Markets Wealth Management
Technology
2013
Debt
2014 2015
Seed/Angel
2016 2017 2018
Series A
Not disclosed
Top ntech companies
Company Description Funding (€)
Cash Credit Financial services for the unbanked 18.9M
Software Group Helps nancial service providers digitize 5.2M their business
Klear P2P lending and nancial education 2.8M platform
Fabric Token Easy Access to blockchain technology and 800K smart contracts
Yatrus Analytics Analytics platform 83K
Reloyalty Mobile app that recognizes. returns and 44K respects loyalty
Sensika Cloud-based. single-access-point informa- Technologies tion intelligence platform
31K
Transmetrics Software for transport network optimization 30K
Tickey Mobile ticketing app for smart cities 27K
getix POS solutions for small and medium outlets 22K
Investor
# of investment
LAUNCHub Ventures 2
TMT Investments 2
NEVEQ 1
Black Peak Capital 1
Microsoft 1
Delta Partners Capital Limited 1
PostScriptum Ventures 1
Eleven Accelerator Venture Fund 1
Altair Capital 1
Kickstart Accelerator 1
Selected Top VC investors ranked by number of investment in local ntechs from 2008-2018. Lowest category ranked by date of investments.
Sources: Tables include ntechs headquatered in Bulgaria. Funding rounds and amounts are relative to the period 2008-2018 and exclude M&A and IPO deals, but include debt. Source: BCG FinTech Control Tower
Country data
Source: Eurostat, IMF, European Commission, RBI/Raiffeisen RESEARCH Latest available data as of 2017/2018
Data for 2018, estimates Source: ECB, national sources, World Bank, RBI/Raiffeisen RESEARCH
Total bank assets (€ Bn) 50
Total bank assets / GDP (%) 99
Account ownership (% of population) 72
Debit card ownership (% of population) 69
Internet usage (% of population) 63
Usage of internet to pay bills (% of population) 13
Send/received digital payments (% of population) 65
Population (M) 7.1
GDP total (€ Bn) 54
GDP per capita (€, at PPP) 13,900
GDP growth (%) 3.3
Of cial currency BGN
29.9K
66.1K 31.2K
131.4 K
801.8 K
1.46M 1.35M
2.84 M
5.24 M
