
Page 31 - RBI FIntech Atlas 2018
P. 31
31
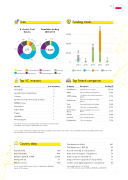
Size
# of active local ntechs
5 3 4 1 2 2 39%
Funding trends
1% 24 1
23% 40
Insurance Corporate Banking Retail Banking SME Banking
Top VC investors
14% 19 11%
Cumulative funding 2008-2018
€30M
€20M
14% 5% 4% 9% 2%2%
9 6 3% 5
171 € 64M 67
€10M 72%
Capital Markets Wealth Management
Technology Support
Series A
2017 Series B
0
2014 Seed/Angel
2015 2016
2018 Not disclosed
Funding (€)
29.1M
5.9M
5.5M
3.3M
2.6M
2.5M
2.2M
2.2M
2.1M
1.5M
427
92
87
79
76
51
82
Top ntech companies
Investor
# of investment
Flint Capital 2
SpeedUp Venture Capital Group 2
Techstars 2
Barclays Accelerator (Powered by Techstars) 1
OPOKA Ventures 1
Data Ventures 1
Capitec Bank 1
Pragma 1
LUXNOVA 1
BlueYard Capital 1
Company
Cream nance
MAM
SALESmanago
CashDirector
FinAi
BitStar
Liber Finance Group
Akredo
LeaseLink
Kredytmarket
Description
Financial Services Company
Reduce monthly utility bill payments
Cloud based online marketing automation platform
Virtual CFO & real-time accounting platform
Fintech platform driven by big data
Online bitcoin exchange platform
AI-driven marketplaces for consumer nance
Alternative Loan Provider
Online leasing transactions
Online loan granting
Selected Top VC investors ranked by number of investment in local ntechs from 2008-2018. Lowest category ranked by date of investments.
Sources: Tables include ntechs headquatered in Poland. Funding rounds and amounts are relative to the period 2008-2018 and exclude M&A and IPO deals, but include debt. Source: BCG FinTech Control Tower
Country data
Population (M) 38.0
GDP total (€ Bn) 496
GDP per capita (€, at PPP) 21,900
GDP growth (%) 5.1
Of cial currency PLN
Source: Eurostat, IMF, European Commission, RBI/Raiffeisen RESEARCH Data for 2018, estimates
Total bank assets (€ Bn)
Total bank assets / GDP (%)
Account ownership (% of population)
Debit card ownership (% of population)
Internet usage (% of population)
Usage of internet to pay bills (% of population)
Send/received digital payments (% of population)
Latest available data as of 2017/2018
Source: ECB, national sources, World Bank, RBI/Raiffeisen RESEARCH
1.3M
5.5M 7.7 M 767K
1.4M
1.8M
12.9M 3M 16M
10.4M 23.1M
33.6 M
