
Page 35 - RBI FIntech Atlas 2018
P. 35
35
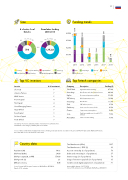
Size
Funding trends
# of active local ntechs
Cumulative funding 2008-2018
€40M 8% 5% 3%3%4% 2%5% 1%2% 9% €30M
3 3 4 8 515 2 2
15 9 6 6 7 12% 43 22%
16% 31
Insurance Corporate Banking Retail Banking SME Banking
Top VC investors
Life.Sreda
inVenture Partners
QIWI Venture
Prostor Capital
Flint Capital
Vostok Emerging Finance
Target Global
Runa Capital
Da Vinci Capital
Finam Global
€20M €10M
0
198 € 292M 81
41%
68%
Capital Markets Wealth Management
7
7
5
4
4
4
3
3
3
3
Technology Support
Seed/Angel
2013 2014 2015
Debt
Not disclosed
2016
Series A
2017 2018 Series B
Top ntech companies
Company Description Funding (€)
Tinkoff Bank High-tech branchless banking 47.2M
Bistrodengi Micro nance and other nancial services 44.9M
Biglion Discounts and promotions platform 23.4M
TOT Money Mobile payment processor 12.0M
Viva Dengi Micro nance 11.3M
Zhuk SME advisory services 9.7M
CarMoney Loans secured on motor vehicles 8.5M
Comino Cryptocurrency mining device 8.4M
2can Transforms smartphones into mobile POS 7.8M terminals
MoneyMan Online consumer lending 7.7M
Investor
# of investment
Selected Top VC investors ranked by number of investment in local ntechs from 2008-2018. Lowest category ranked by date of investments.
Sources: Tables include ntechs headquatered in Russia. Funding rounds and amounts are relative to the period 2008-2018 and exclude M&A and IPO deals, but include debt. Source: BCG FinTech Control Tower
Country data
Population (M) 146.3
GDP total (€ Bn) 1,400
GDP per capita (€, at PPP) 17,600
GDP growth (%) 2.3
Of cial currency RUB
Source: Eurostat, IMF, European Commission, RBI/Raiffeisen RESEARCH Data for 2018, estimates
Total bank assets (€ Bn) 1237
Total bank assets / GDP (%) 93
Account ownership (% of population) 76
Debit card ownership (% of population) 57
Internet usage (% of population) 76
Usage of internet to pay bills (% of population) 35
Send/received digital payments (% of population) 71
Latest available data as of 2017/2018
Source: ECB, national sources, World Bank, RBI/Raiffeisen RESEARCH
3.6M
5.4M 12.5 M
594K
11M 11.6 M
2.8M
5.7 M
24.3M
3.5M
2.8M
16.6M 6.1M
13.4M
39.7 M
12M 6.8M
3.6M
10.5M 34.2 M
20.1M
8.4M
8.4M 37 M
1.2M
2.7M
770K
