
Page 39 - RBI FIntech Atlas 2018
P. 39
39
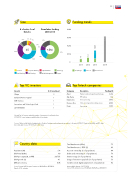
Size
# of active local ntechs
Funding trends
€5M 33 3 3 8
€3M €2M
€1M 0
Cumulative funding €4M 2008-2018
11% 3% 3% 3% 3% 4 111
17%
18%
Top VC investors
Wayra
Earlybird Venture Capital
OTB Ventures
Innovations and Technologies Fund
J&T VENTURES
1
26% 9
Insurance Corporate Banking Retail Banking SME Banking
6 17% 8%
35
12
57%
34%
Capital Markets Wealth Management
2
1
1
1
1
Technology Support
Seed/Angel
Series A
2013 2014
2015 2018
Not disclosed
Top ntech companies
Company Description Funding (€)
Minit Payment cards and supporting technologies 3.2M
Zlty Melon P2P lending 1M
Datamolino Invoice processing 597K
Business Box Online invoicing and accounting services 456K
Keepi E-accounting 336K
Investor
# of investment
Selected Top VC investors ranked by number of investment in local ntechs from 2008-2018. Lowest category ranked by date of investments.
Sources: Tables include ntechs headquatered in Slovakia. Funding rounds and amounts are relative to the period 2008-2018 and exclude M&A and IPO deals, but include debt. Source: BCG FinTech Control Tower
Country data
Population (M) 5.4
GDP total (€ Bn) 90
GDP per capita (€, at PPP) 24,705
GDP growth (%) 4.1
Of cial currency EUR
Source: Eurostat, IMF, European Commission, RBI/Raiffeisen RESEARCH Data for 2018, estimates
Total bank assets (€ Bn) 75
Total bank assets / GDP (%) 89
Account ownership (% of population) 84
Debit card ownership (% of population) 76
Internet usage (% of population) 82
Usage of internet to pay bills (% of population) 53
Send/received digital payments (% of population) 82
Latest available data as of 2017/2018
Source: ECB, national sources, World Bank, RBI/Raiffeisen RESEARCH
379K
552K
455K 1.35M 1.4 M
3.2 M
