
Page 9 - RBI FIntech Atlas 2018
P. 9
9
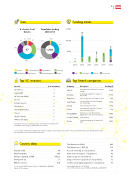
Size
# of active local ntechs
Funding trends
30 34% 13% 2 2 9 6 62 1
Cumulative funding 2008-2018
€15M
6% 6% 2% 2%
9% 2%1% 21%
€10M 29%
€5M
0
5 5 22 8
87 1821% €29M
20% 17
Insurance Corporate Banking Retail Banking SME Banking
Top VC investors
34%
Capital Markets Wealth Management
Technology Support
Series A
Not disclosed
2013 Debt
2014 2015 Seed/Angel
2016 2017 2018
Top ntech companies
Company Description Funding (€)
wikifolio Austria-based online platform for investment 7.6M strategies
Kompany Global RegTech platform for audit-proof 6.2M KYC & UBO
Cashpresso Offers a mobile rst. revolving line of credit 6M
Smart Engine Customer loyalty and retention programs 3.2M from Smart Engine
DaoPay Offers micropayment solutions 1.9M
Finnest Loan platform for SMEs and is currently 1M active in the DACH region
PrimeCROWD Startup-investor network that matches 970K high-pro le investors with selected startups
bsurance GmbH InsurTech startup 554K
Conda Crowdinvesting platform for start-ups and 526K SME
Investor
# of investment
Speedinvest 7
Livag GmbH 4
AC & Friends GmbH 4
Floor13 3
Reimann Investors 3
DvH Ventures 2
Arax Capital Partners 2
i5invest 2
Lang & Schwarz 2
AWS Double Equity 2
Selected Top VC investors ranked by number of investment in local ntechs from 2008-2018. Lowest category ranked by date of investments.
Sources: Tables include ntechs headquatered in Austria. Funding rounds and amounts are relative to the period 2008-2018 and exclude M&A and IPO deals, but include debt. Source: BCG FinTech Control Tower
Country data
Population (M) 8.8
GDP total (€ Bn) 386
GDP per capita (€, at PPP) 44,221
GDP growth (%) 2.7
Of cial currency EUR
Source: Eurostat, IMF, European Commission, RBI/Raiffeisen RESEARCH Data for 2018, estimates
Total bank assets (€ Bn) 849
Total bank assets / GDP (%) 219
Account ownership (% of population) 98
Debit card ownership (% of population) 90
Internet usage (% of population) 87
Usage of internet to pay bills (% of population) 52
Send/received digital payments (% of population) 96
Latest available data as of 2017/2018
Source: ECB, national sources, World Bank, RBI/Raiffeisen RESEARCH
430K
2.2M 9.8M 12.1M
2.6M
1.7M 71K 1.8M
1.2M 1.5M
3.3M 6M
4.2M
