The most important Sustainable Development Goals (SDGs) for RBI:
• SDG 1: To end all poverty
everywhere.
• SDG 4: Assuring inclusive,
equitable and high-quality
education and promoting lifelong
learning opportunities for all.
• SDG 5: Achieve gender equality
and empower all women and girls.
• SDG 7: Ensuring access to
affordable, reliable, sustainable
and contemporary energy for all.
Transparency and disclosure Regulations and controlling
Medium Very high
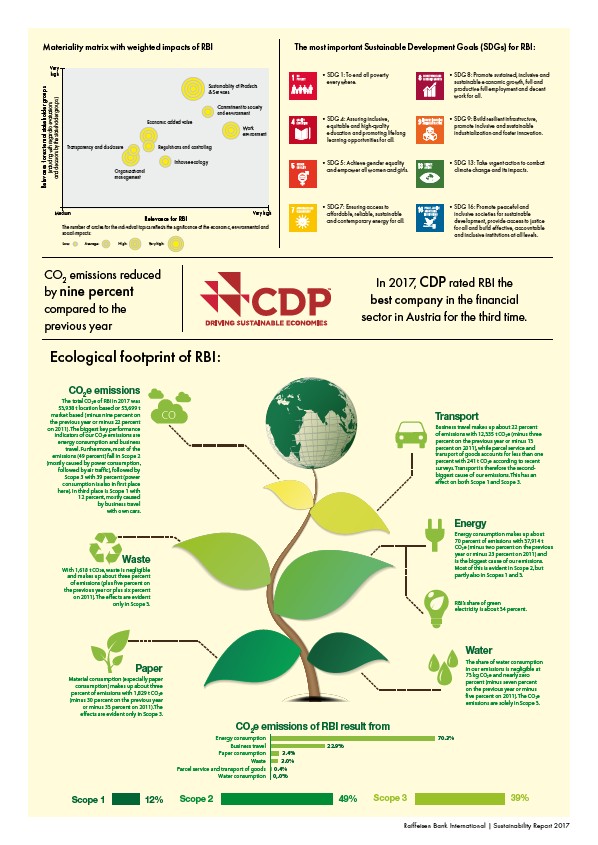
Ecological footprinCt oOf RBI: 2e EMISSIONS OF RBI IN 2017
Paper
Material consumption (especially paper
consumption) makes up about three
percent of emissions with 1,829 t CO2e
(minus 30 percent on the previous year
or minus 33 percent on 2011).The
effects are evident only in Scope 3.
• SDG 8: Promote sustained, inclusive and
sustainable economic growth, full and
productive full employment and decent
work for all.
• SDG 9: Build resilient infrastructure,
promote inclusive and sustainable
industrialization and foster innovation.
• SDG 13: Take urgent action to combat
climate change and its impacts.
• SDG 16: Promote peaceful and
inclusive societies for sustainable
development, provide access to justice
for all and build effective, accountable
and inclusive institutions at all levels.
Transport
Business travel makes up about 22 percent
of emissions with 12,335 t CO2e (minus three
percent on the previous year or minus 13
percent on 2011), while parcel service and
transport of goods accounts for less than one
percent with 241 t CO2e according to recent
surveys. Transport is therefore the secondbiggest
cause of our emissions. This has an
effect on both Scope 1 and Scope 3.
Energy
Energy consumption makes up about
70 percent of emissions with 37,914 t
CO2e (minus two percent on the previous
year or minus 23 percent on 2011) and
is the biggest cause of our emissions.
Most of this is evident in Scope 2, but
partly also in Scopes 1 and 3.
Water
The share of water consumption
in our emissions is negligible at
73 kg CO2e and nearly zero
percent (minus seven percent
on the previous year or minus
five percent on 2011). The CO2e
emissions are solely in Scope 3.
RBI’s share of green
electricity is about 34 percent.
CO2e emissions
The total CO2e of RBI in 2017 was
53,938 t location based or 53,699 t
market based (minus nine percent on
the previous year or minus 22 percent
on 2011). The biggest key performance
indicators of our CO2e emissions are
energy consumption and business
travel. Furthermore, most of the
emissions (49 percent) fall in Scope 2
(mostly caused by power consumption,
followed by air traffic), followed by
Scope 3 with 39 percent (power
consumption is also in first place
here). In third place is Scope 1 with
12 percent, mostly caused
by business travel
with own cars.
Waste
With 1,618 t CO2e, waste is negligible
and makes up about three percent
of emissions (plus five percent on
the previous year or plus six percent
on 2011). The effects are evident
only in Scope 3.
CO2e emissions of RBI result from
Energy consumption
Business travel
Paper consumption
Waste
Parcel service and transport of goods
Water consumption
70.3%
22.9%
3.4%
3.0%
0.4%
0,.0%
Scope 1 12% Scope 2 49% Scope 3 39%
Raiffeisen Bank International | Sustainability Report 2017
Materiality matrix with weighted impacts of RBI
Relevance for external stakeholder groups
(including with regard to evaluations
and decisions by the stakeholder groups)
Sustainability of Products
& Services
Commitment to society
and environment
Work
environment
Inhouse ecology
Organizational
management
Economic added value
Relevance for RBI
Very
high
The number of circles for the individual topics reflects the significance of the economic, environmental and
social impacts:
Low: Average: High: Very high:
CO2 emissions reduced
by nine percent
compared to the
previous year
In 2017, CDP rated RBI the
best company in the financial
sector in Austria for the third time.